INDEX
The oil market has been influenced the last three weeks by the constant rise of oil and energy due to the unprecedented increase in the price of natural gas, reflecting the unsatisfied demand and restrictions in its transportation infrastructure.
During this period, the Brent and WTI oil price markers have registered an increase in their quotations of 12.4% and 13.4%, respectively.
At the end of the first week of October, the markers continued to rise after the U.S. Department of Energy stated they had no plans to release their strategic oil reserves.
The rise in oil prices has been supported by the results of the 21st OPEC+ Ministerial Meeting held on October 4, which concluded with no changes in the group’s oil production levels, ratifying the agreement reached at the 19th meeting held on July 18, to maintain a month-on-month increase of 400 thousand barrels per day.
There were expectations in the oil market that OPEC+ would increase its production levels to 800 thousand barrels per day, starting in November. Both to help the recovery of the world economy and to prevent a worsening of the inflationary phenomenon experienced in the U.S., China and Europe, as a result of the massive financial resources injected for the recovery of the post-COVID-19 economy, as well as the problems in the reestablishment of the distribution and supply chains to the industrial and manufacturing sector derived from the pandemic.
During September, the oil price has remained above $68 per barrel, reaching over $79 on September 27, reaching quotations not seen in the market since October 2018.
For its part, the International Energy Agency (IEA), in its latest report of September, projects a rebound in demand by 1.6 million barrels per day for October, expecting it to continue to increase for November and December.
Due to natural events and the OPEC+ decision, the supply restrictions raise fears that the price will continue to climb and reach the threshold of 90 dollars per barrel for the winter season in the northern hemisphere, as estimated by the U.S. investment and securities bank, Goldman Sachs.
OPEC+’s decision not to increase oil production while keeping supply restricted to a market under stress, with unsatisfied demand, may have many readings and probably geopolitical reasons due to the prevalence of the interests of Russia and Saudi Arabia within it.
While Russia is interested in making Europe (affected by the unprecedented rise in gas prices since June) feel its dependence on gas supplies imports and the importance of the completion of the Nord Stream 2 project (vehemently opposed by the U.S.); the Saudi Kingdom (to whom various U.S. envoys and spokesmen have asked to release more oil to the market) seems to want to remind Washington its weight, influence and its geopolitical importance in the face of an eventual nuclear agreement between the U.S. and Iran.
In any case, the logical decision of OPEC+, from a strategic point of view and taking into account the group’s interests, would have been to increase production -up to 800 thousand barrels per day as expected by the market- to contain oil price. In this way, they would help constrain inflation and, therefore, the recovery of the world economy and demand, but also -and this is very important for OPEC+- preventing other producers or more costly projects from entering the market.
Also, OPEC+, in a balance of interests of its member countries, must make an effort to maintain fossil energies – mainly oil – as the most economical and available energy option to sustain the recovery and growth of the world economy. The above, especially to respond to consumer countries’ strong campaign and public policy decisions to impose restrictions on fossil energies in favour of other energy sources, both renewable and – even – atomic energy.
PRICE
On October 8, at the closing of the European markets, Brent (ICE Future Europe) and WTI (NYMEX), crude oil markers continued to rise, trading at 83.07 and 79.74 dollars per barrel, respectively. An increase of more than 4.5 dollars for both markers in the first week of October.
BRENT AND WTI CRUDE OIL PRICES
(September – October 8 2021)
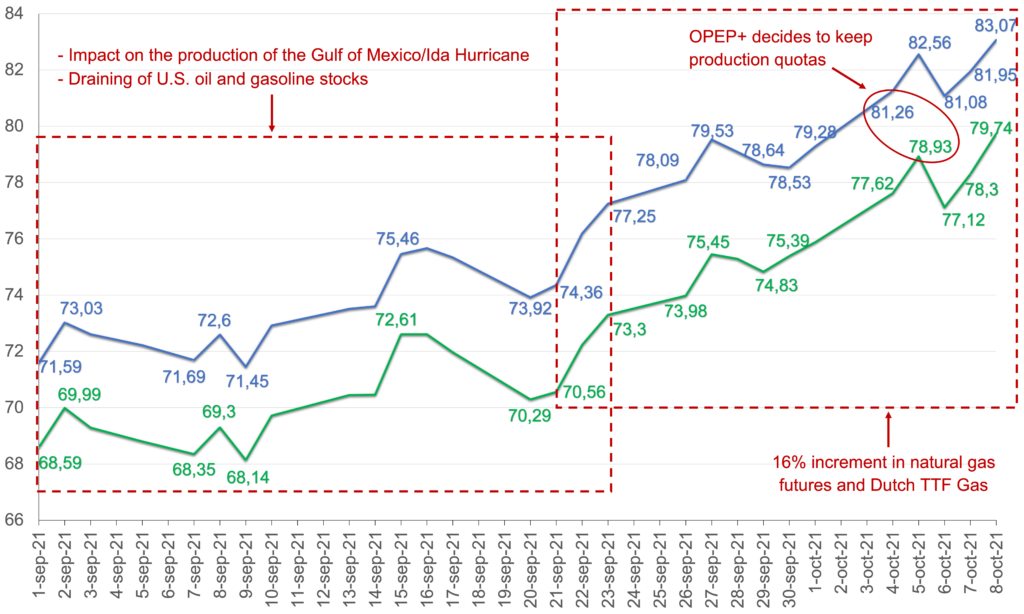
Since September 21, oil prices have increased due to a higher oil and gas demand, the impact of Hurricane Ida through the Gulf of Mexico and the Louisiana coast -which affected the production of 23 million barrels of oil-. In addition, the decision of OPEC+ in its last meeting on October 4, to keep its oil production quotas.
Current Brent and WTI quotations represent an annual increase of 96% and 90%, respectively, and 39% and 37% over 2019 quotations, indicating the recovery in global oil demand.
In response to this situation, and to maintain the price of oil at around 70-75 dollars per barrel, both the U.S. government and the Chinese government released 11 million barrels from their commercial reserves and 10 million barrels from their strategic reserves in order to influence in the market and prevent the cost of energy from affecting their growth and recovery goals; however, these measures had a one-off effect, to meet their domestic needs, but did not change the upward trend of prices in the international market.
The rise in oil price coincides with the unprecedented increase in the price of natural gas in Europe and Asia, rising more than 450% from its previous price, thus forcing the electricity generation and industrial sectors to seek other sources of energy such as coal or petroleum products.
NATURAL GAS PRICE INCREASE IN EUROPE
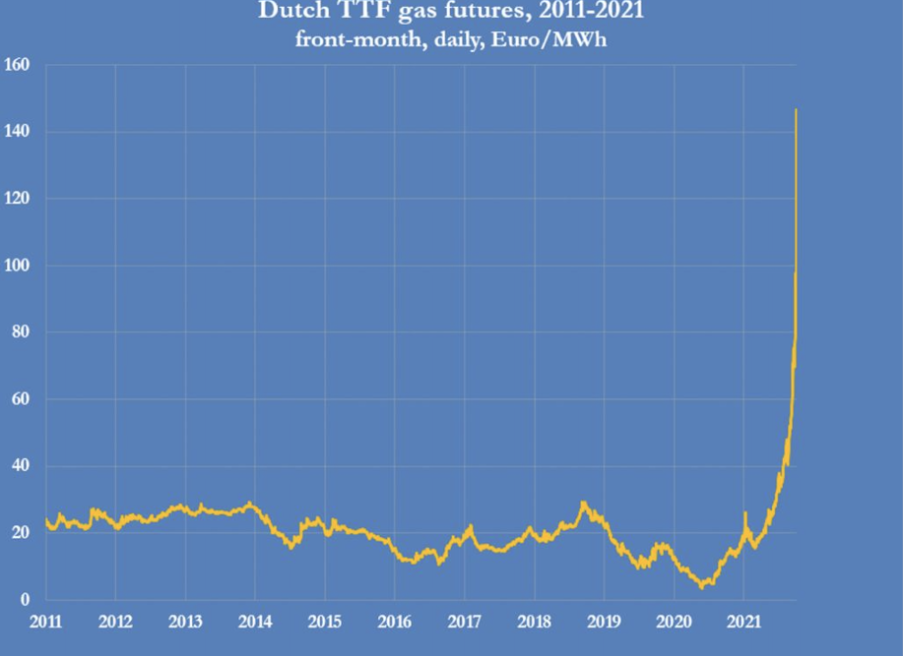
The gas crisis in Europe has triggered emergency meetings of the European Union, which have assessed the need to establish a joint strategy and increase their storage capacities.
However, only the intervention of President Vladimir Putin on October 6, announcing that Russia’s Gazprom will honour its contracts and increase the supply of Russian gas through Ukraine, has given a prospect of a solution to this crisis that points to a worsening in the northern hemisphere’s winter season.
OPEC Reference Basket (ORB)
The OPEC oil reference basket (ORB) was traded on October 7 at 78.6 dollars per barrel after exceeding 80 dollars the two previous days. The ORB quotation was 84.5% above its quotation in November 2020, managing to maintain its upward trend, except in August 2021, with values in June, July, September and October not seen since October 2018.
OPEP REFERENCE BASKET PRICE
(September 1 – October 7)
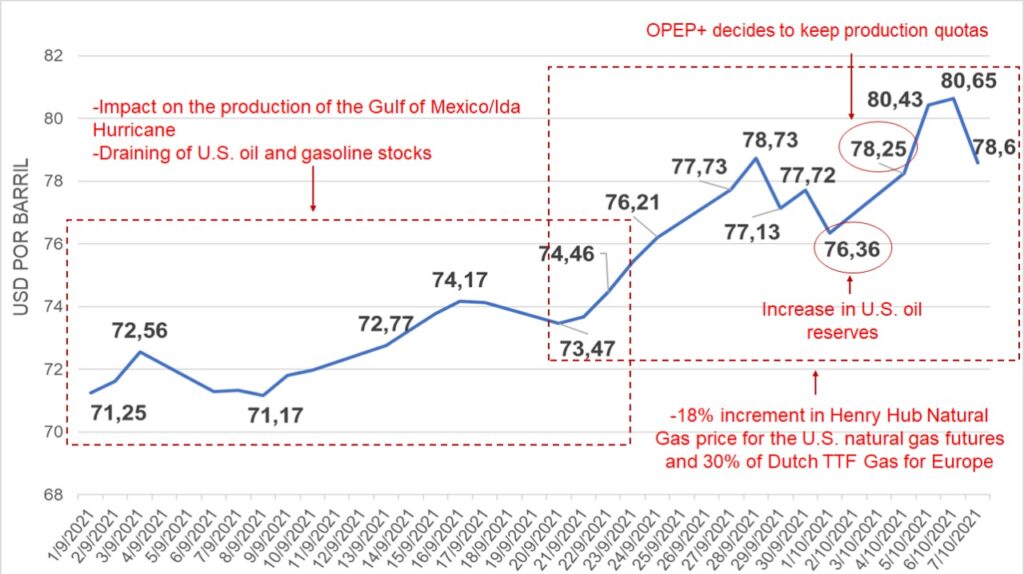
Since June 2021, the ORB has managed monthly quotations with an average above $70 per barrel, which had not happened in more than two years.
Gas Price
Unlike oil, the gas price structure corresponds to an immature market, where the restrictions for its handling and transportation cause the price to be established -with important differences- depending on the geographic location of the supply source. Thus, the North American, Asian and European markets have entirely different gas structures and prices.
The North American market is supplied entirely by local production of conventional and shale gas, transported by pipeline from the source and priced at the Henry Hub. Surpluses allow gas to be exported to Mexico and Europe via Liquefied Natural Gas (LNG).
For Asia, a net importer, natural gas is mainly received via LNG cargoes from the Middle East and Australia. Its price is determined in forward contracts, requiring liquefaction plants and maritime transport in special ships from the supply source and regasification plants and distribution pipelines in the consuming country.
Europe, for its part, has an extensive distribution infrastructure but is equally dependent on supplies -via pipelines- from large producing countries such as Russia, Norway, Algeria, Libya and other small producers, in addition to supply via LNG. This situation and the extensive use of gas on the European continent mark a strong energy dependence which -regarding exports from Russia- become political problems keeping Europeans with the dilemma of diversifying or substituting gas, fundamentally through renewable energies and atomic energy. The latter is now the subject of a complex debate.
Although established in different geographic locations, gas prices are indexed to the oil price, so their prices have a mutual effect. Both are fossil energy sources (gas and oil derivatives) between which the consumer and, above all, the electricity and industrial sector, depending on the price situation, can temporarily choose between one or the other without too many technical restrictions.
Gas prices have experienced an unprecedented increase in its main markets since January of this year: USA, Europe, and Asia.
The North American market
The Henry Hub Natural Gas (NGX1), benchmark marker for the natural gas market in the USA, listed on the New York Stock Exchange (NYMEX), marked a 145% growth in its quotation during 2021, with values not recorded since 2010 and 2011, closing the day on October 07 at 5.67 dollars per million BTU (MMBTU).
HENRY HUB NATURAL GAS (NGX1) QUOTATION
(January 3 – October 7 2021)
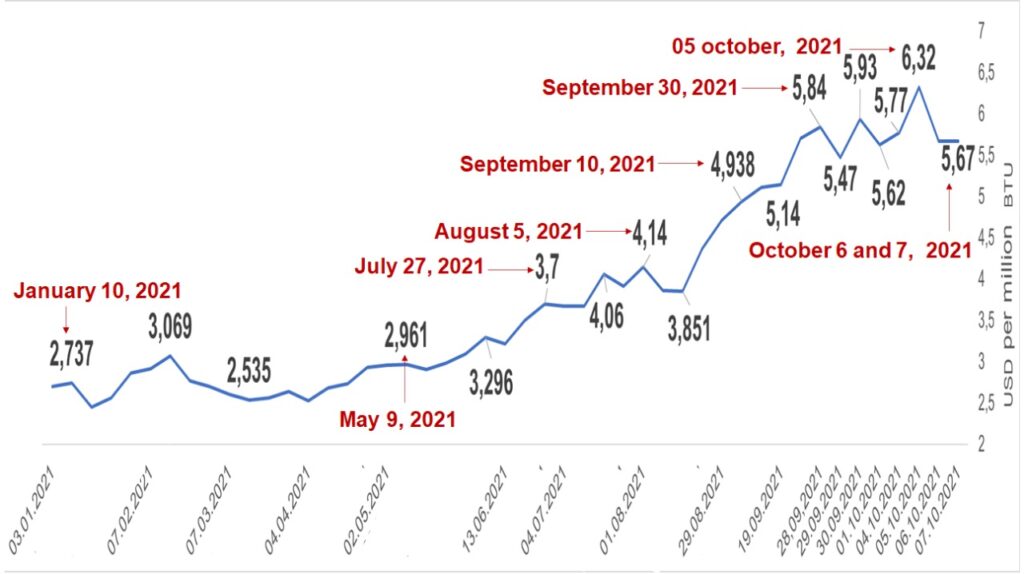
The increase in LNG consumption in the Asian market allowed the entry of U.S. LNG. At the same time, Argentina and Brazil increased their LNG imports from the U.S. Brazil, along with South Korea and China, are the top recipients of U.S. gas, which increased its demand during spring and summer in the northern hemisphere (fall and winter in Argentina and Brazil), increasing its exports by 14% since October 2020, reaching historical peaks, above 10 billion cubic feet/day, between March and August 2021. Between June 1 and August 26, the NGX1 price rose 37%.
At the same time, the high summer temperatures in the U.S. led local demand to consume the commercial reserves of U.S. gas, which generated problems in its supply, to which must be added the impact left by Hurricane Ida, affecting up to 94.5% of gas production in the Gulf of Mexico as of September 1 -which has not recovered 100%-, while Hurricane Nicholas forced the closure of the Freeport LNG gas export terminal in Texas between September 14th and 18th.
The European market
During the second half of the year, gas for power generation has increased by more than 165% per MWh, with peaks that passed 340%. The above is due to disinvestment in gas production, the fall in European gas reserves to 74% of their capacity and Russia’s decision to slow down gas supplies to Europe since the end of July this year. In the meantime, Gazprom announced, on September 10, the completion of the construction of the Nord Stream 2 pipeline (55 billion cubic meters per year), which runs from Russia to Germany and will come into operation at the end of this year.
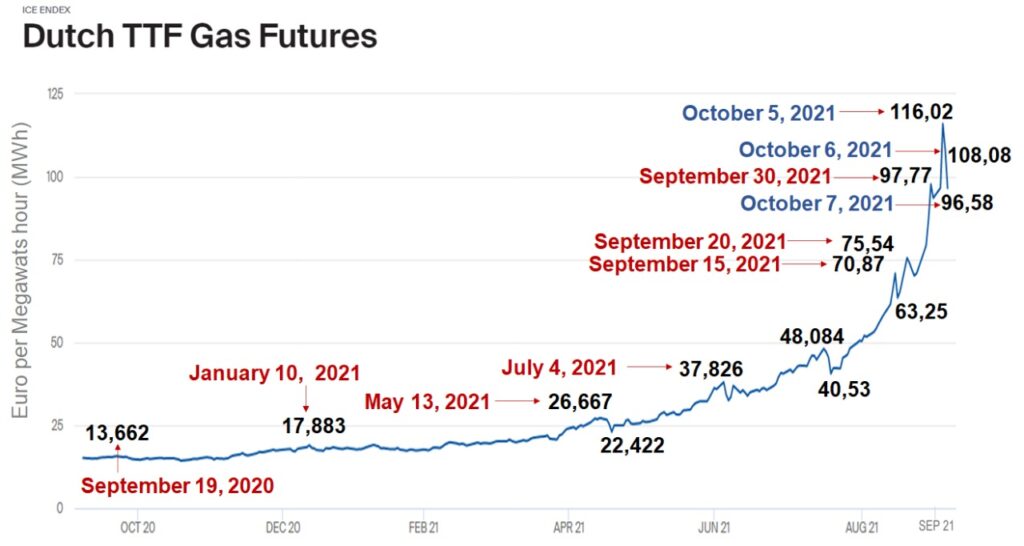
The Dutch TTF Gas Future, the marker traded on the ICE ENDEX exchange of the Intercontinental Exchange (ICE) for the gas market in Europe, presented an exorbitant increase of 450% since the beginning of 2021 (on October 05, it reached 550%), achieving historical peaks in its value.
On October 7, the Dutch TTF was quoted at 96.58 euros per MWh, its second day of decline since the statements made the day before by Vladimir Putin. The Russian president said that Gazprom needs to comply with the contractual agreements to supply gas to Europe through the Ukrainian gas pipelines and affirmed that Russia doesn’t want the gas price to keep increasing, bringing peace of mind to the European market.
On October 6, the Dutch TTF price soared by 39%, reaching an all-time high of 161.5 euros/MWh; however, the Russian president’s intervention caused the European gas marker price to fall by more than 53 euros, to close the day at 108.91 euros/MWh,
The questioning of Vladimir Putin’s government by the European Parliament, where several deputies point out that the lack of Russian gas supply is to pressure the German government to approve the activation of gas transportation through the Nord Stream 2 pipeline, together with the race of Europe and Asia to supply themselves with LNG and increase their commercial reserves, to cover demand in the winter season, amid the global crisis in gas production, has generated significant uncertainty in the supply-demand relationship in the market and led the price of gas to close on October 5 at 116.02 MWh, with its price rising 20% in 24 hours, surpassing 100 euros for the first time.
GAS PRICE INCREMENT IN EUROPE
(September 29, 2020 – October 7, 2021)
The Asian market
The LNG indicator for the Asian market, the Japan / Korea market (JKM Platts LNG), which is quoted on both the NYMEX and the ICE, closed on October 06 at 56 USD/MMBTU, with a 40% increase on the day, showing a 290% increase since June 21. The above is due to the fall in regional gas inventories, the closure of wells, the fall in production and the influence of the gas price in Europe in the middle of the summer season and forecasts for the winter.
China, Japan, Korea and Taiwan, are advancing their own «battle» against Europe for access to U.S. LNG while buying LNG at any price, both in Asia and Europe. Japan bought LNG exceeding its storage capacity and has it in ships off its coasts, while Korea, together with Brazil, became the largest importer of US LNG; in turn, China became the largest buyer of LNG in the world, displacing Japan. According to the S&P Global Platts agency, the price of JKM Platts will fall after the winter, with quotations that may be between 11 and 15 dollars/MMBTU.
On September 21, the Secretary General of OPEC, Mohammad Barkindo, and the president of Qatar Petroleum, Saad Sherida al Kaabi, issued a warning and alerted on the disinvestment in which the gas industry finds itself, due to the international political pressure being exerted on the energy transition, creating, in the words of both actors, «a crisis in the gas supply» and the increase in its price which will continue to affect its quotations during the winter season in the northern hemisphere.
OIL PRODUCTION
World oil production
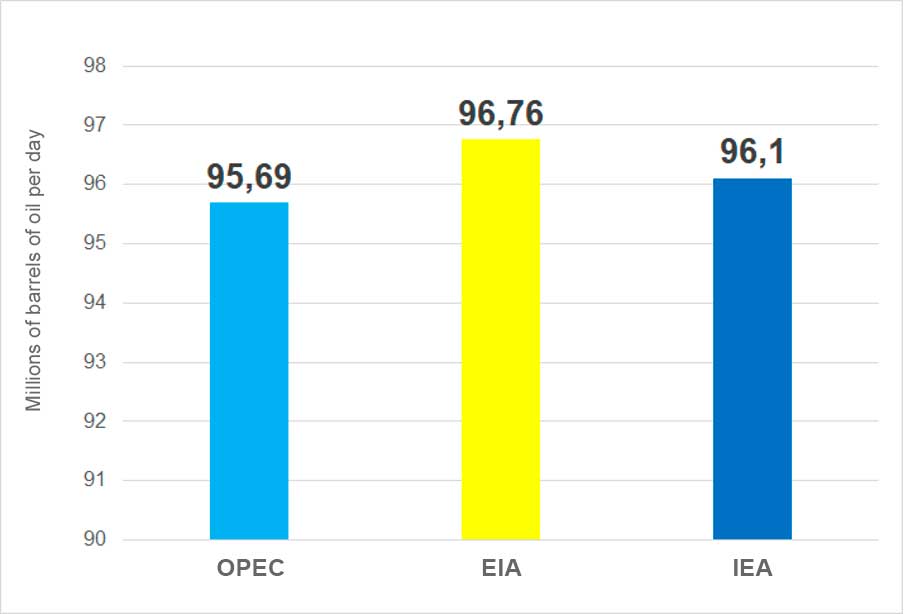
Data from OPEC’s latest Monthly Oil Market Report (MOMR) on September 13 put world production of oil, condensates, LNG and unconventional liquids at 95.69 million barrels per day for August, while the EIA projected it at 96.76 million barrels per day and the IEA at 96.1 million barrels per day, a difference of 1.1 million barrels per day and 500 thousand barrels per day, respectively, concerning OPEC’s data.
WORLD OIL PRODUCTION
(August 2021)
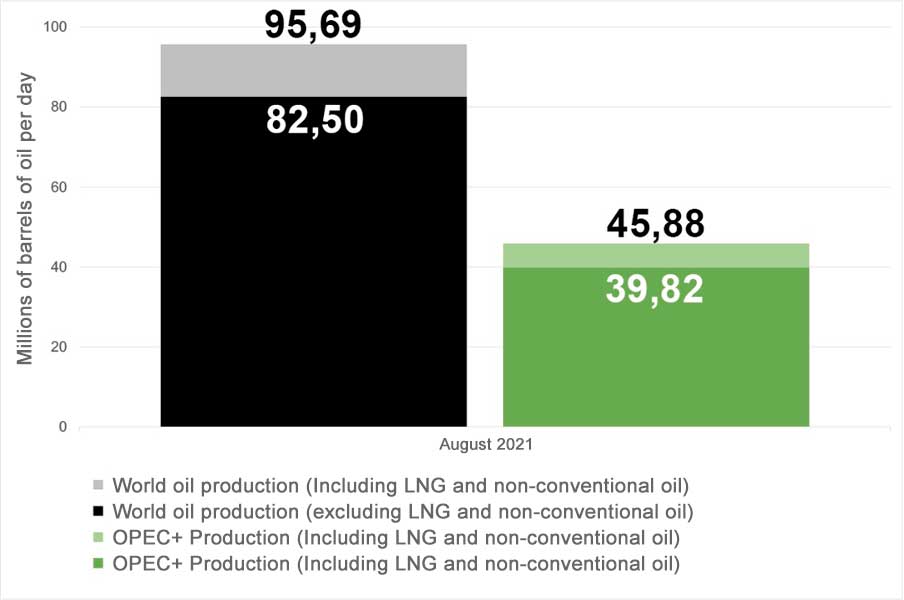
Excluding condensates, LNG and non-conventional oil in the U.S., Russia and OPEC, world oil production stands at 82.5 million barrels per day, according to OPEC data published in the referred MOMR, as well as EIA information corresponding to September 8 and Russian Ministry of Energy data published in August.
WORLD PRODUCTION
of crude oil, condensates, LNG and non-conventional liquids
(August 2021)
OPEC+ production
From the 82.5 million barrels per day corresponding to world oil production, 48.26% corresponds to OPEC+ (39.82 million barrels per day). Of the total OPEC+ production, 67.2% -26.762 million barrels per day- corresponds to the production of OPEC countries participating in the cuts, while 32.8% -13.06 million barrels per day- corresponds to Non-OPEC countries participating in the agreements.
Production cuts
In compliance with the agreements of the 19th OPEC+ Ministers’ Meeting, in August 2021, a relaxation of 400 thousand barrels per day of oil in the group’s cuts came into effect, bringing the total cut to 5.36 million barrels per day in the month.
For the rest of 2021, OPEC+ production will be governed according to the scheme agreed last July 18, so that the September production cut will be 4.959 million barrels per day, in October 4.559 million barrels per day, in November 4.159 million barrels per day and in December 3.759 million barrels per day, closing the year with a decrease of 5.94 million barrels per day with respect to the original cut of 9.7 million barrels per day, which began on May 1, 2020.
OPEC Production
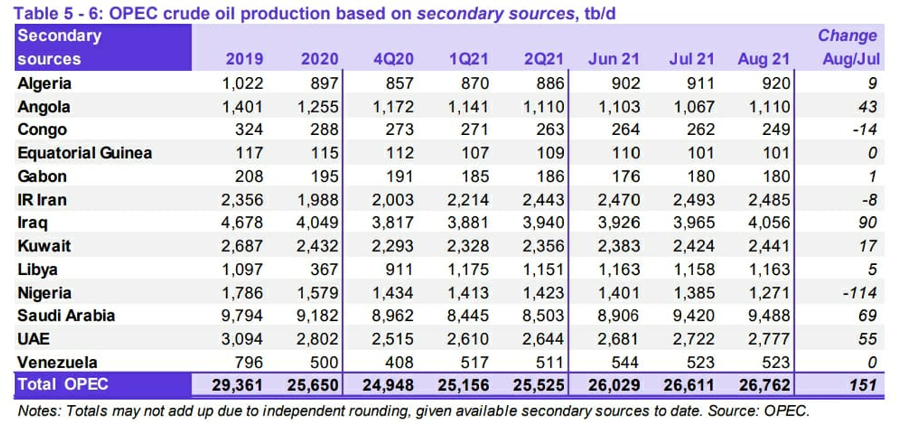
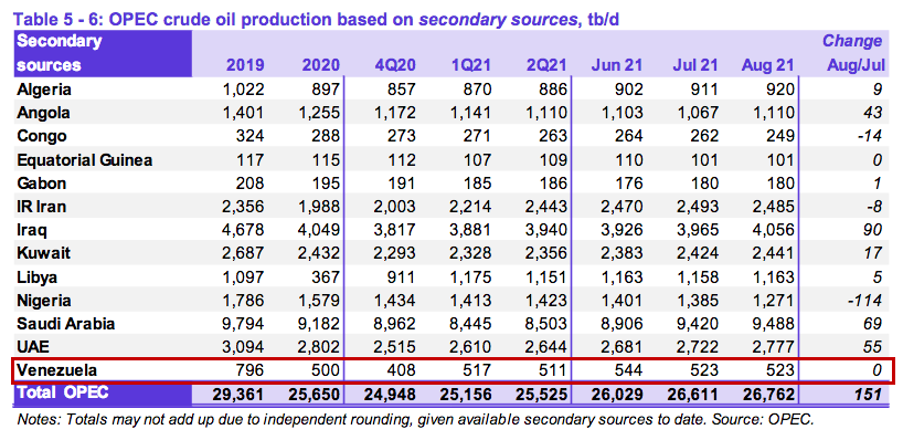
According to data from OPEC’s MOMR on September 13, the oil production of member countries as of August was 26.762 million barrels per day – its highest level in 16 months – due to the easing of their production.
OPEC COUNTRIES’ PRODUCTION
(August 2021)
Gulf oil producers
Saudi Arabia, United Arab Emirates, Kuwait and Iraq produced 18.762 million barrels per day -231 thousand barrels per day more than in July-, corresponding mainly to Saudi production, representing 70.1% of OPEC production and 47.18% of OPEC+ production.
African Producers
Nigeria, Angola, Algeria, Congo, Gabon and Equatorial Guinea presented a production of 3.821 million barrels per day -75 thousand barrels per day less than the previous month, representing 14.28% of OPEC production and 9.6% of OPEC+ production.
Producers outside the cuts agreement
Iran, Libya and Venezuela – the three OPEC countries exempt from production cuts – reported a combined production of 4,162 million barrels per day, of which 2,485 million barrels per day (59.71%) corresponds to Iran, equivalent to 9.32% of OPEC production. Libya produced 1,165 million barrels per day (4.37% OPEC) and Venezuela 523 thousand barrels per day (1.92% OPEC).
These results indicate that the Gulf monarchies and Iraq are the beneficiaries of the increase in the production quota agreed on July 18 and ratified on September 1, as they are the only OPEC+ countries to see a considerable increase in their production thus increasing their influence in the oil market. The internal problems of Angola and Nigeria in stabilizing and recovering their production, together with those already existing in Iran, Libya and Venezuela, allow the four major Gulf producers to make a «de facto» redistribution of the official production quotas of the member countries. One of the most affected countries is Venezuela, given the collapse of its production (a drop of 83 % compared to the 2013 level) and the lack of prospects for its recovery.
Russia
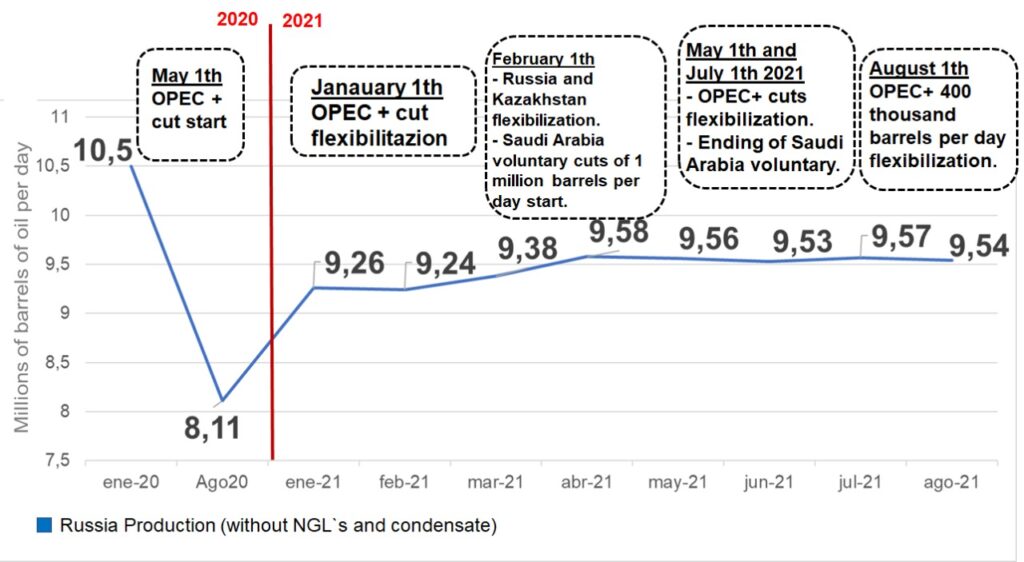
According to the data published by the Ministry of Energy of the Russian Federation, the country’s oil production in August -without condensates nor NGLs- stood at 9.54 million barrels per day. This is 30 thousand barrels per day less than in July, the first time it has been below its production quota since it began production cuts in May 2020.
Russian oil production has seen an annual increase of 430 thousand barrels per day, up 4.72% from its production levels 12 months ago, thanks to OPEC+’s policy of easing cuts. However, it still sits 960 thousand barrels per day – 9.15% – below its January 2020 record production levels of 10.5 million barrels per day before COVID-19.
RUSSIA’S OIL PRODUCTION
(January 2020-August 2021)
United States
U.S. oil production for August was 11.07 million barrels per day, being slightly below the average of 11.2 million barrels per day that has been recorded since November 2020.
Hurricane Ida’s in the Gulf of Mexico affected the production of 30 million barrels of oil between August 27 and September 23, causing a monthly drop of 225 thousand barrels per day in August and 770 thousand barrels per day in September. The recovery of operations in the Gulf of Mexico took 20 days, with production closing at 11.1 million barrels per day and 11.3 million barrels per day for September 24 and October 1, respectively, according to EIA data in its weekly report of October 06.
In its September 08 Short-Term Energy Outlook (STEO), the EIA projects U.S. oil production of 10.7 million barrels per day for September.
U.S. OIL PRODUCTION *
(January 2020 – August 2021)

Source: Own elaboration with STEO data of August 10, 2021, from the U.S. Energy Information Administration (EIA).
On the other hand, the number of active drilling rigs in the U.S. was affected by the passage of Hurricane Ida, where platforms in the Gulf of Mexico had to be evacuated, with the result that drilling activity, at the close of the week of September 3, fell from 410 to 394. As of September 17, there were 411 operating rigs, maintaining the recovery, which reached 433 rigs at the close of the week of October 08, presenting an annual increase of 240 rigs, but 279 below the activity presented in 2019, according to the Baker Hughes weekly report.
POLITICS
Difficulties of the energy transition
The gas price crisis experienced in Europe and Asia reflects – among many other aspects – the high dependence of industrialized economies on fossil fuels and the weaknesses in the viability of the energy transition, at least in the terms and goals being discussed in Europe.
The price of gas in Europe has risen by 370% between May and October, which has been reflected in a significant increase in consumers prices, affecting the economic recovery process by increasing the costs of domestic gas and electricity services for the population in general, and the costs of the industrial and manufacturing sector, putting pressure on inflation, a risk factor that has emerged in post-pandemic economies.
Several factors have contributed to the rise in gas prices in Europe: the increase in oil prices to which gas prices are indexed, the restriction in the transportation and distribution infrastructure, the restrictions on the supply of Russian gas through Ukraine, the delay in activating the second phase of the Nord Stream gas pipeline – subject to sanctions and objections from the U.S. – as well as the increase in the price of gas in Europe. Although they are markets with different characteristics, they are not the only ones with the same characteristics but also with the same characteristics.
Although they are markets with different characteristics, the increase in LNG price in Asia and Europe has caused an increase in gas export cargoes -via LNG- from the U.S., which has led to an increase in the price of natural gas in the North American market.
The increase in the price of natural gas and LNG is affecting the economic recovery of industrialized countries, which do not have a substitute energy source other than fossil fuels. Renewable energies: wind and solar, do not cover the energy needs of Europe and Asia – net energy consumers – even in the current economic situation.
Facing the price increments of oil and natural gas, major consumers in the productive sectors, with no access to renewable energy alternatives, have opted to use coal – increasing its price in turn – and are even inclined to use atomic energy, two energy sources that are more polluting and dangerous than any other.
Policymakers face the dilemma of how to satisfy the expectations of the public opinion regarding climate change, which has become a topic of political debate, especially in Europe and the U.S., and at the same time, ensure the economic recovery in the face of the devastating effects of the COVID pandemic.
On the other hand, lobbying and pressure from companies that develop renewable energies are promoting a strong campaign to promote the sale and use of their products, which are often based on the promise – without technical and economic support – of a prompt substitution of fossil energies. This creates expectations that are not supported by reality, causing disinvestment in the conventional energy sector and political decisions that compromise energy security and the possibilities of economic development of countries dependent on energy imports.
The reduction of carbon emissions into the environment must be a goal shared by the international community, but taking into account the tremendous asymmetries in development between countries.
The developed world – including China – must adjust its consumption patterns to reduce wasteful energy use and environmental emissions, as these are the most polluting countries. The industrial and manufacturing complexes of the large industrialized economies must adapt to use more efficient, less polluting and energy-intensive technologies.
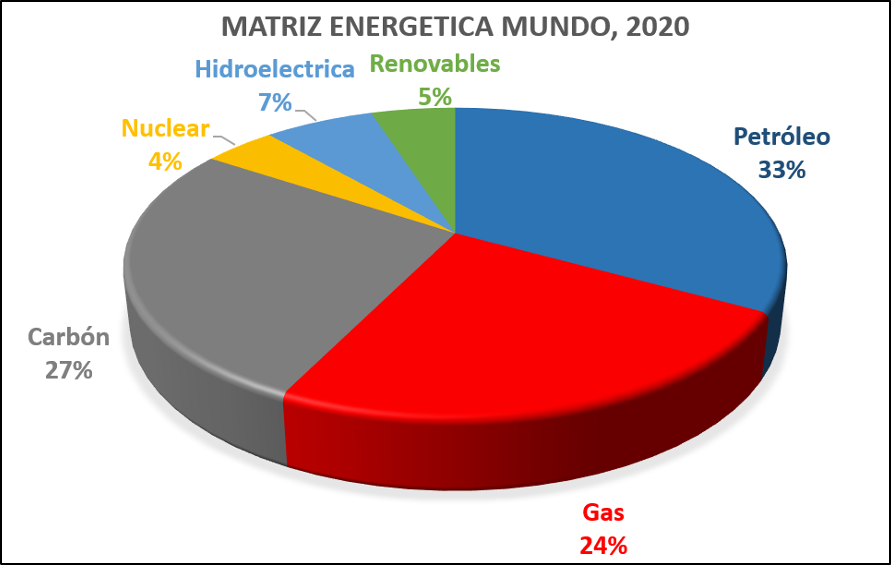
From the gas crisis and the increase in oil prices is clear that there is no renewable energy capable of substituting in the short term fossil energies, which, according to data from the International Energy Agency as of 2020, still constitute 84% of the world energy matrix, while renewable energies constitute only 5%.
An energy transition and a strategy to reduce carbon emissions into the environment must include, in addition to a change in consumption patterns, a reduction in lavish and intensive energy expenditures, as well as insisting on the transition from coal to gas, technological adjustments to large industrial and manufacturing complexes towards more efficient technologies, and the reduction of emissions in the transportation sector, favouring mass and more efficient means of collective transportation.
Iran-US: Awaiting resumption of negotiations
The international community is awaiting the seventh round of negotiations of the Joint Commission of the Joint Comprehensive Plan of Action (JCPOA) in Vienna (Austria) to continue the talks once the new Iranian government of Seyyed Raisi has been installed.
On September 21, before the participation of Iran and the U.S. in the U.N. General Assembly, the spokesman of the Iranian Foreign Ministry, Saeid Jatibzade, assured that the meetings of the Commission, where authorities of both countries hold indirect meetings, would «resume in the coming weeks». On the same day, U.S. President Joe Biden affirmed that his government «is working with the P5+1 to engage Iran diplomatically and seek a return to the JCPOA», reiterating that his administration «is prepared to return to full compliance (with the JCPOA) if Iran does the same».
For his part, Iranian Foreign Minister Hossein Amir Abdolahian expressed the full readiness of Seyyed Raisi’s government to resume negotiations with the Commission in Vienna «very soon». However, he clarified that the new authorities are «evaluating» the previous six rounds of meetings in which the previous government (HassanRohani’s) participated.
Earlier, on September 15, an unexpected statement from a senior Israeli official, Defense Minister Benny Gantz, who expressed his willingness for the U.S. to negotiate a new agreement with Iran, indicating a change in the Israeli position and opening the possibility for an agreement to return to the original JCPOA nuclear deal.
The diplomatic path seems to be the path chosen by the administrations of both countries to reach an agreement, which would lift sanctions against Iran and bring the Persian nation back to its role as an important oil and gas producer, a balancing factor in the international oil market.
Norway: Center-left wins «climate election».
On September 13, parliamentary elections were held in the Kingdom of Norway, Europe’s largest oil and gas producer, to form a government, which were won by the centre-left with 47.1% of the votes, 88 deputies, thus enabling them to form a government without depending on the support of the Greens (Ecologists) and the Reds (former communists). Although it is their second-worst election in 100 years, The Labor Party was the most voted with 26% of the ballots. Its leader, Jonas Gahr Støre, will form a government with the Centrist Party (13.5%) and the Socialist Left (7.6%). Negotiations to form the new executive began on September 14.
In this election process, the central topic of discussion was the climate, carbon emissions, and energy sources. On the one hand, Labor and the centrists agree that reducing carbon emissions with respect to 1990 should be 55%. The leftist socialists demand that it should be 70%. At the same time, the new government assured that they will give continuity to the hydrocarbon industry but limiting its investments. Also, they will not carry out any new activity in the northernmost areas of the Norwegian Continental Shelf, which refers to the Barents Sea and the Greenland Sea.
Similarly, investments will be made in decarbonization on the Norwegian Continental Shelf (Norwegian Sea, Greenland Sea and the Barents Sea), and, according to Støre himself, there will be no new exploration operations in the Barents Sea. The new government made it clear that to boost, incentivize and finance renewable energies and achieve «green change», it is necessary to rely on the revenues brought in by the hydrocarbon industry.
The hydrocarbon industry in Norway represents 14% of the GDP, more than 40% of its exports and 9% of the workforce (160 thousand employees), where the surpluses derived from the production of its hydrocarbons are deposited in two sovereign funds belonging to the State, grouped in the Norwegian Government Pension Fund, which has a value of 1.3 trillion dollars.
These oil revenues have allowed the State to finance and encourage the production and use of renewable energies, making Norway the country with the highest sales of electric cars and the nation that makes the most use of renewable energies.
ECONOMY
The outlook for economic recovery during 2021 and 2022 is maintained under the assumption that the pandemic is in a containment phase in industrialized and emerging economies, maintaining the pace of growth in productive activity. From an economic standpoint, it is estimated that COVID-19 will no longer slow the recovery beyond current levels, despite the recent increase in COVID-19 cases in the United States and other developed and emerging countries.
According to OPEC’s economic analysis, the global Gross Domestic Product growth forecast remains unchanged for 2021 and 2022 at 5.6% and 4.2%, respectively.
The economic growth forecast for the United States remains unchanged at 6.1% for 2021 and 4.1% for 2022. Likewise for the eurozone (4.7% for 2021 and 3.8% for 2022), Japan (2.8% and 2.0%) and China (8.5% and 6%). In contrast, for India, 2021 has been revised down to 9% (from 9.3% in August), following a weaker-than-expected recovery, maintaining the 2022 growth forecast of 6.8%. Also positive are the forecasts for other economies such as Brazil (4.7% and 4.2%) and Russia (3.5% and 2.5%). The latter benefiting from OPEC+ agreements to stabilize the oil market.
Among the most sensitive elements to be monitored is inflation, which is on the rise in many countries around the world, due to factors such as the massive monetary aid packages, the easing of movement restrictions during the first half of the year, which increased the demand for goods and services, and temporary supply shocks, particularly restricted by the disruption of supply chains and global trade.
The supply of goods and services was limited due to the closures and limitations to production during 2020. In this regard, the economies of scale of many industries were affected to respond to the growing demand. Thus, they respond to such demand with a price increase, as is happening. It remains to be seen how long and how large this increase will last and how it will affect the post-pandemic economic recovery.
As for inflation, it would be expected not to exceed the annual average of the Organization for Economic Cooperation and Development (OECD) countries, around 2% by 2021 and below that figure by 2022.
Thus, according to the MOMR’s economic estimates, the central banks of the so-called G4 (the United States, the eurozone, the United Kingdom and Japan, issuers of the most important currencies) will not make unexpected interest rate hikes before 2023.
However, the United States has recovered only about 17 million jobs out of the 22.4 million lost during 2020 due to factory and retail closures as part of the measures to contain the COVID-19 outbreak, equivalent to 76% of the pre-pandemic total. Thus, labour shortages in certain areas and countries, especially the service sector, could impact inflation.
In addition, there are political elements that will influence the economic environment in the coming months, such as the current discussions on fiscal policies in the U.S. Congress, the general elections in Germany and the possibility of tax increases in several economies amidst the accumulation of sovereign debt that continues to increase as a consequence of the economic aid packages applied by the United States and other industrialized and emerging nations to alleviate the impact of the pandemic.
In the particular case of the Americans, the U.S. House of Representatives and Senate passed President Biden’s temporary funding bill in early October, avoiding a technical shutdown of the Executive Branch by extending it until December 3. In addition, Biden expects to pass his infrastructure bill, which is opposed by several members of his party, while it has Republican support in the Senate. This bill proposes to invest more than US$4 trillion in road and air infrastructure, Internet improvements and to address the climate emergency.
As a result of rising oil and gas prices, China decided to increase coal production in Inner Mongolia (north of the country) to ensure the operation of its factories and home heating. This situation has once again highlighted the difficulty of reducing the world economy’s dependence on fossil fuels.
DEMAND
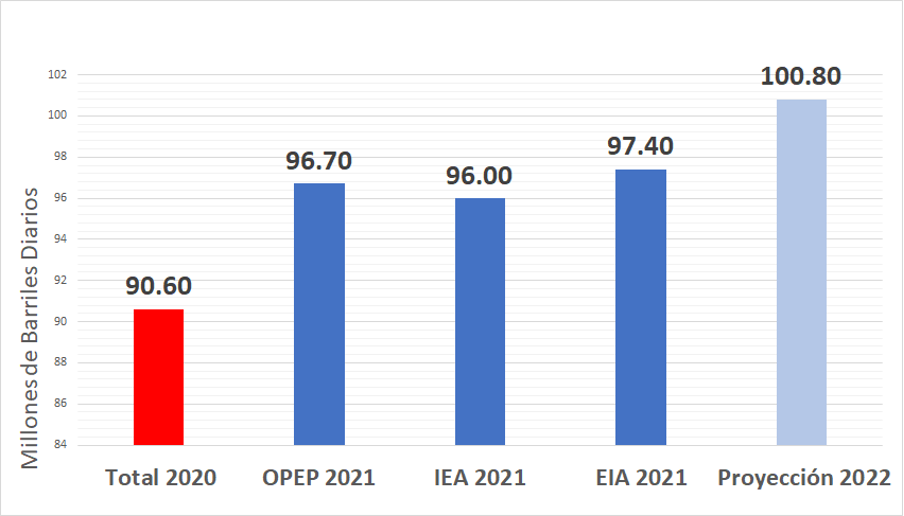
According to the September 2021 MOMR, world oil demand is expected to increase by 6.0 million barrels per day, with a slight upward adjustment from the August estimate (+0.1), reaching 96.7 million barrels per day at year-end.
For its part, the International Energy Agency (IEA) maintains its previous month’s estimate of 96 million barrels per day due to the balance between the forecast of a drop in global demand during the third quarter of 2021 (due to the resurgence of cases of COVID-19 contagion in Asia) and the projection of a 1.6 million barrels per day recovery in oil consumption for October, with upward expectations in November and December. Meanwhile, the U.S. Energy Information Administration (EIA) adjusted its forecast slightly downward (-0.2), at 97.4 million barrels per day.
The three energy agencies maintain their assumptions of higher oil demand for the second half of 2021, supported by growing mobility, more dynamic economic and commercial activity, and the progress of mass vaccinations.
Thus, optimistic scenarios based on sustained economic growth, supported by the stimulus packages of the major economies and greater control over COVID-19, are maintained.
Additionally, in the current context of restrictions on Europe’s access to natural gas and the needs of the winter months, demand for crude oil and derivatives could begin to increase at a higher rate than initially forecast.
By 2022, global oil demand is forecast to increase by 4.2 million barrels per day on a year-over-year basis, revised upward by about 0.9 million barrels per day compared to last month’s report, with the pace of recovery expected to be stronger as the impact of the pandemic is minimized, bringing total demand to 100.8 million barrels per day and surpassing pre-pandemic levels.
Of the 4.2 million barrels per day demand increase forecast for 2022, 1.8 MMDB year-on-year is expected to come from OECD countries, while 2.3 MMDB will come from non-OECD countries, supported by increased economic activity in major economies most notably China and India.
WORLD OIL DEMAND
(2020 – 2021)
UNITED STATES
According to the latest available data, for July, U.S. oil demand increased by approximately 3.0 million barrels per day (16%) from a year earlier, reaching 21 million barrels per day. Gasoline (1.0 million barrels per day year-over-year), jet/kerosene (0.6 million barrels per day) and LPG (0.5 million barrels per day) accounted for most of the increase. Both gasoline and kerosene increased by nearly 1.6 million barrels per day combined due to an 11.5% increase in ground transportation, according to the Federal Highway Administration, as well as industrial production, as fuels required by it increased by 9.9% y-o-y.
Rising vaccination rates and the expected impact of stimulus programs along with higher household savings are the basis for positive forecasts for oil demand for the remainder of 2021, even taking into account the possible emergence of new COVID-19 variants.
By 2022, U.S. oil demand is forecast to increase by more than 0.9 million barrels per day, with petrochemicals and transportation as the sectors of the economy that will require the most oil. Demand constraints could be reduced business travel and the continuation of fuel substitution and fuel efficiency programs.
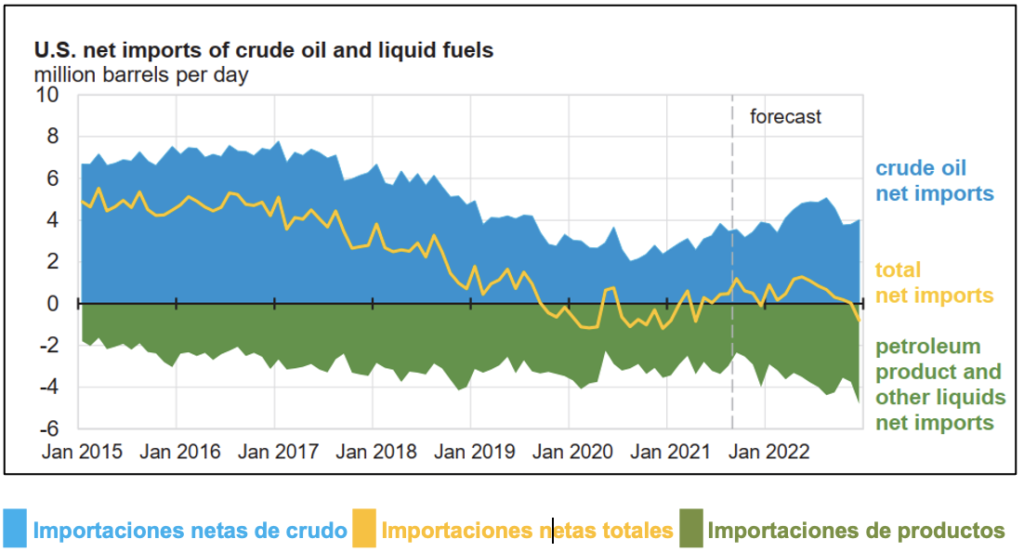
U.S. NET IMPORTS OF CRUDE OIL AND LIQUID FUELS
(million barrels per day, projection March 2021- December 2022)
CHINA
China’s oil demand increased by about 0.2 million barrels per day y-o-y in July (1.4%), driven mainly by strong demand for light distillates for petrochemicals, LPG and naphtha, China’s National Bureau of Statistics reported on September 16.
Through July, Chinese oil demand registered an increase of nearly 1.2 million barrels per day compared to the same period in 2020, with the first quarter showing an increase of around 1.7 million barrels per day year-on-year, given a stronger demand for light distillates and transportation fuel, as a result of increased land mobility and passenger flights.
With the recent enactment of measures to counter the spread of the Delta variant, coupled with the slowdown in key macroeconomic indicators, oil demand could be negatively impacted. However, China’s global demand for 2021 remains unchanged and is expected to be around 1.1 million barrels per day.
Similarly, by 2022, oil demand is expected to increase, supported by economic growth forecasts, with the transportation and manufacturing sectors as mainstays, followed by petrochemicals.
INDIA
India’s oil demand increased by 0.3 million barrels per day y-o-y in July (8%), reaching a high of 4.14 million barrels per day. However, demand remained below July 2019 levels by 0.3 million barrels per day, mainly due to the middle distillate backlog.
According to the Central Statistical Organization of India, the increase is mainly based on higher diesel and gasoline consumption amid higher domestic mobility and improved agricultural and industrial activities, with the latter increasing by more than 127% over the same period in 2020.
Gasoline demand is now on par with pre-pandemic levels and showed a marginal increase compared to July 2019. Meanwhile, light distillates, LPG and naphtha increased marginally from January to July compared to the same period last year, supported by steady petrochemical demand and an increase in LPG demand for domestic use.
By 2022, India’s oil demand is expected to continue to increase, surpassing pre-pandemic levels based on improved coronavirus containment. Refined products for industry and transportation fuels will drive the increase.
OIL STORAGE
The market trend continues to point to continued inventory drain in 2021, below the record levels reached in 2020 and below the average in the 2015-2019 period, higher than the increase in petroleum product storage in the same period.
OECD countries
According to OPEC’s MOMR, OECD countries’ commercial crude oil and product inventories adjusted their data, standing at 2,912 million barrels in July. This is 10.5 million lower than in June, falling by 306 million barrels from the same period in 2020 (36 million more than the annual difference in June) and 106.9 barrels below the 5-year average (16.5 million more than in June). Days of inventory coverage was 63.7 days, up 0.1 days from June and 11.6 days lower than July 2020.
According to OPEC data, the only commercial inventories of crude oil and petroleum products that did not show a monthly drop in OECD countries were European stocks, which had a monthly increase of 12.2 million barrels in July.
OPEC: CRUDE OIL INVENTORIES IN OECD COUNTRIES
(July 2020 – July 2021)

Of the total OECD commercial inventories, 1,404 million barrels correspond to crude oil, presenting a drop of 5.6 million barrels in relation to June of this year, placing 183.5 and 106.5 million barrels of oil below June 2020 and the average of the last five years, respectively.
Meanwhile, 1,508 million barrels of commercial inventories correspond to oil products, presenting an increase of 16 million barrels with respect to June and 5.8 higher than the average of the last five years, despite presenting a decrease of 122.6 million to June 2020.
For its part, the EIA, in the STEO of last September 8, estimated in 2,865 million barrels the total inventories of crude oil and oil products in the OECD countries for July, a monthly drop of 11 million barrels, foreseeing the existence of an annual decrease of 346 million barrels, 16 million more than the annual difference estimated the previous month.
United States
Since August 27, when Hurricane Ida hit the Gulf of Mexico, affecting oil production by 30 million barrels, commercial crude oil inventories in the U.S. had a drain of 4.5 million barrels, to stand at 420.887 million barrels as of October 1. According to data from the EIA weekly report of October 6, it presents an annual decrease of 72 million barrels of crude oil in storage, 4 million barrels less than the annual ratio recorded in August.
Between August 27 and September 17, 11.4 million barrels were drained from U.S. commercial stocks, offset by a surprise recovery of 6.9 million barrels between September 18 and October 1.
So far in 2021, U.S. commercial inventories have fallen 64 million barrels, despite showing an increase of 16 million barrels in storage between February 19 and April 19 (as a result of the winter storm that affected oil operations in Texas and Louisiana) and 6.92 million barrels the week of October 1, following the recovery of production in the Gulf of Mexico.
In August 2021, commercial inventories were at 424.029 million barrels, down 15.07 million barrels from July (down 8.1 million more than the monthly ratio recorded the previous month) and 51.8 million with January of this year. The EIA’s projections for September forecast a 3.76 million barrel increase in commercial inventories, with an average of 427.79 million barrels for the month.
U.S. COMMERCIAL CRUDE OIL INVENTORIES
(January 2020 – October 1 2021)
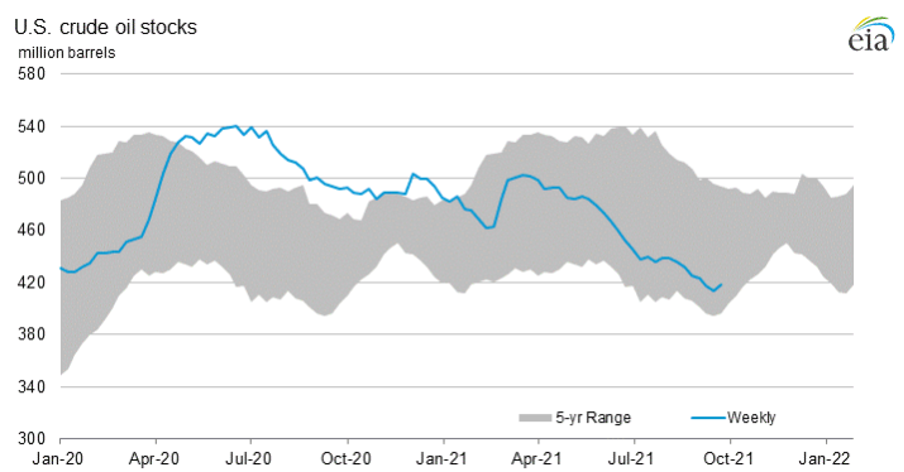
The trend of U.S. crude oil inventories in 2021 continues to be estimated downward, adjusting the year-end projection to 435.668 million barrels, 5 million barrels lower than the projection estimated in August.
For October 1, days of coverage dropped to 27.6 days for the week. At the time of Hurricane Ida’s landfall in the Gulf of Mexico, August 27, cover days were 26.5. Between the end of February and March 19, 2021, coverage days were above 40 days, with an all-time high of 41.8 days on March 12.
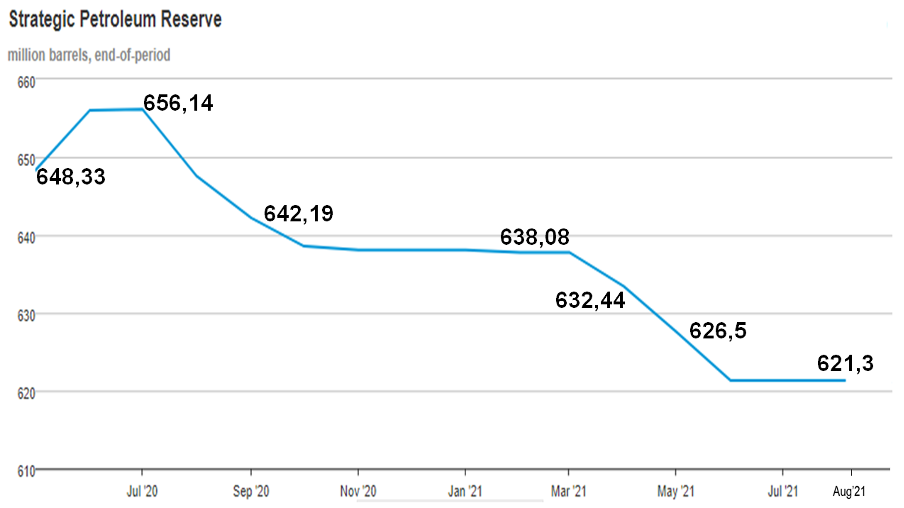
On the other hand, for the same October 1, strategic reserves stood at 617.77 million barrels of oil, 3.5 million barrels less than the week of September 3, presenting, for the first time since June 25 (when they drained 5.2 million barrels in one week), a drop in their records, and for four consecutive weeks. However, the August data did not register variations, maintaining the volumes of strategic reserves at 621.3 million barrels of oil, a level that, at the last monthly record, has remained unchanged since June 2021.
The U.S. strategic reserves show a drop of 28.69 million barrels over their highest level in August 2020, after former President Donald Trump authorized in April last year the use of strategic reserves to store the excess production of U.S. operators after the collapse of the Cushing Oklahoma. The latter has reduced inventory since November 2020 to stand at 35.31 million barrels in September. That is a weekly drop of 1.1 million barrels after registering 36.42 million barrels on September 03, after three weeks of increase that allowed it to recover 2.8 million barrels since August 13, when it recorded its lowest volume since October 2018.
STRATEGIC OIL RESERVES
U.S. STRATEGIC PETROLEUM RESERVES
(May 2020-August 2021)
VENEZUELA
Venezuelan oil production stagnates, remaining at around 500 thousand barrels per day for the third consecutive month. According to the Monthly OPEC Report (MOMR) issued last September 13, 2021, the country’s oil production stood at 523 thousand barrels per day in August, confirming the complex management problems and the collapse of the national oil industry, which has lost 83% of its production capacity in the 2014-2021 period.
OIL PRODUCTION IN OPEP COUNTRIES
(August 2021)
Despite repeated announcements by the Venezuelan government to increase oil production to 1.5 thousand barrels per day by the end of 2021, PDVSA has failed to exceed 500 thousand barrels per day since February. On the contrary, the capacities of the national oil industry are increasingly diminished due to the deterioration of the infrastructure, the suspension of subsoil works, secondary recovery, added to the chaotic management and the lack of qualified personnel, without any recovery plan and with no prospects of improvement in the short term.
In addition to the collapse of oil and gas production, the country’s oil exports are at their lowest level in the last year, wasting the extraordinary income resulting from the significant recovery of oil prices.
For September, exports reached 414 thousand barrels per day, distributed in 19 cargoes, representing a reduction of 34% to August, according to data issued by ship and tanker tracking companies to which Reuters had access.
With only three months to the end of the year 2021, the promise made by Maduro and his oil minister to increase oil production by 1.5 million barrels not only sounds empty but is unrealistic, out of context and out of PDVSA’s current operational situation.
Paraguaná Refinery Complex workers detained for alleged terrorist actions
Unofficially, it was made known that seven workers of the Paraguaná Refinery Complex were arrested last Thursday, September 23, by members of Military Intelligence, alleging their alleged participation in terrorist actions against the aforementioned oil industry facility.
Coworkers of the detainees, who decided to remain anonymous due to the constant persecution and reprisals against the personnel of Petróleos de Venezuela, stated that the workers were carrying out repairs to the Amuay refinery.
To date, there are more than 120 oil workers detained by the government for numerous reasons, among which are alleged participation in attacks on oil installations, fuel smuggling, conspiratorial activities and even «treason». Repression and persecution of human talent within Petróleos de Venezuela have been one of the causes of the deterioration of the country’s main company, together with disinvestment and the lack of strategic direction to lead the oil industry.
Guyana consolidates in the Essequibo as a new oil province
On September 13, the Caribbean Community (CARICOM), which gathered 15 Caribbean member states and five associated states, issued a declaration that «reiterates its firm and unwavering support for maintaining and preserving Guyana’s sovereignty and territorial integrity». In the same declaration, CARICOM recognizes the Essequibo territory as «Guyana’s Essequibo».
PRESENCE OF TRANSNATIONAL OIL COMPANIES OPERATING IN THE WATERS OF THE ESSEQUIBO TERRITORY AND BLOCKING THE ATLANTIC COAST OF VENEZUELA.
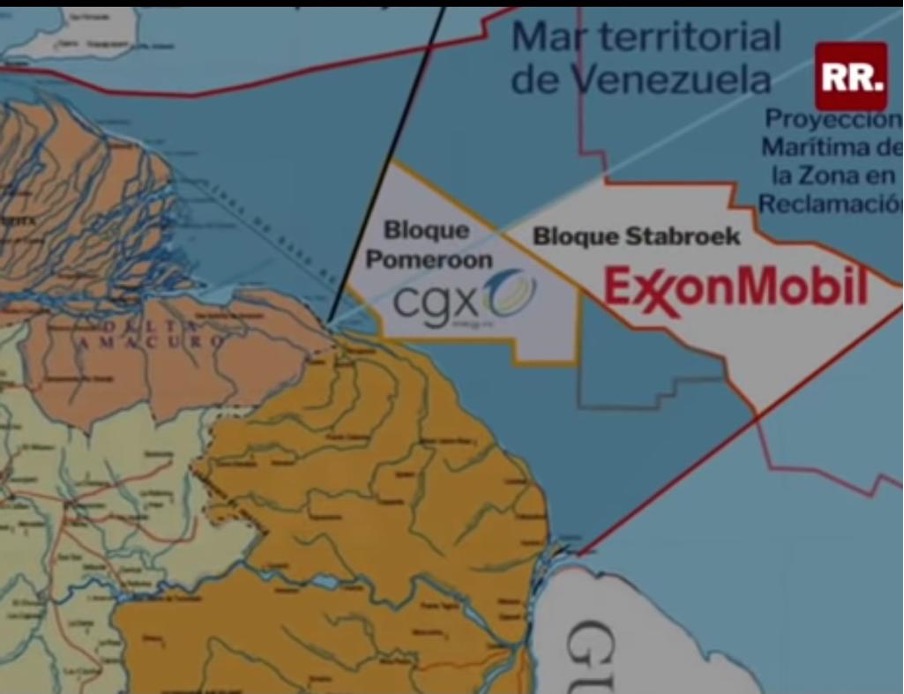
The growing political support obtained by Guyana, not only from the U.S., but also from the Caribbean countries -former allies of the Venezuelan government-, the progress of the case on the sovereignty of the Essequibo introduced by Guyana before the International Court of Justice, added to the political and diplomatic inaction of the Venezuelan government, have created the conditions for the advance of oil operations by transnationals in the waters of the Essequibo territory and the Venezuelan Atlantic coast.
The increase in oil activity and the development of infrastructure for the production and processing of oil and gas in the waters of the Essequibo territory in dispute with Venezuela are, in fact, dispossession of the territory and resources, going beyond the Geneva agreement and the sovereign right of Venezuela to control and develop the natural resources on its continental shelf and preserve its access to the Atlantic coast.
The American companies Exxon Mobil and Amerada Hess and the Chinese company CNOOC are increasing their operations in the Stabroek Block, especially in the Liza field, with reserves of between 3.5 and 4 billion barrels of oil. Today, according to data from August 2021, the transnationals produce 120 thousand barrels per day of oil in the waters of the Essequibo, with plans to increase to 750 thousand barrels per day by 2025, which turns Guyana, one of the poorest countries in South America, into a new oil province, an oil country in the hands of the transnationals.
DEVELOPMENT OF OIL INFRASTRUCTURE IN THE STABROEK BLOCK IN THE WATERS OF THE ESSEQUIBO.
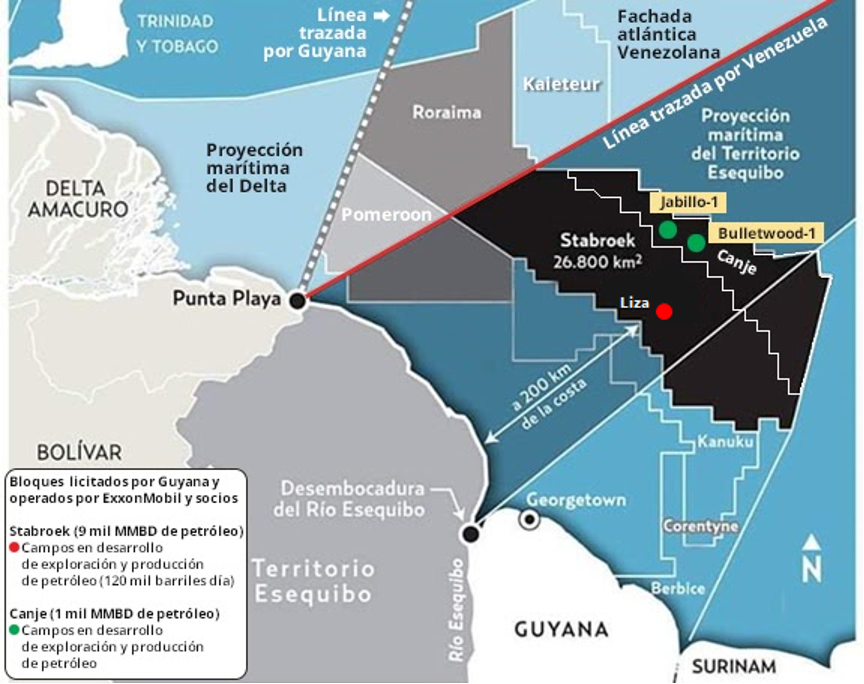
While Venezuelan oil production continues to stagnate at the levels of 1930, the decisions taken by the government of Guyana and the inaction of the current Venezuelan government allowed the transnational oil companies to operate in the waters of the Essequibo, where they continue producing and exporting crude that could be Venezuelan, under the indifferent gaze of the Venezuelan authorities, quantifying the oil reserves at 9 billion barrels with the exploration of 19 oil discoveries in the Stabroek block.
According to the growth projections of the Economic Commission for Latin America and the Caribbean (ECLAC), it is estimated that Guyana will close 2021 with 16% growth, while by 2022, it is estimated to reach 32% growth, thanks to the substantial oil deposits that increase oil activities in its territory.
BIBLIOGRAPHIC REFERENCES:
- [1] US won’t tap into strategic oil reserves – Energy Dep., Tele Trader, 07 octubre 2021.
- [2] 21st OPEC and non-OPEC Ministerial Meeting concludes, OPEP, primero de septiembre 2021.
- [3] «20th OPEC and non-OPEC Ministerial Meeting concludes», OPEP, primero de septiembre 2021.
- [4] Oil Market Report”, Agencia Internacional de Energía (IEA), 12 de septiembre 2021.
- [5] Nakul Iyer y Eileen Soreng, “Goldman expects oil prices to hit $90 by year-end as supply tightens, Reuter, 27 septiembre 2021.
- [6] Prensa, “BSEE Hurricane Ida Activity Final Report”, Bureau of Safety and Environmental Enforcement BSSE, agosto-septiembre 202.
- [7] Weekly Stocks, Administración de Información Energética de EE.UU. (EIA), 30 de septiembre 2021.
- [8] Kshitiz Goliya, “PetroChina, Hengli win 4.43 mil barrels of state crude reserves in China’s first set of auctions”, S&P Global Platts, 24 de septiembre 2021.
- [9] Prensa, “Importaciones sudamericanas de GNL alcanzan récords en junio impulsadas por Brasil y Argentina”, GNL Global, 8 de julio 2021.
- [10] Nota de Prensa, “Alexey Miller: construction of Nord Stream 2 gas pipeline fully completed”, Gazprom, 10 de septiembre 2021.
- [11] Sala de Prensa, “Putin urges Gazprom to continue fulfilling commitments on gas supplies via Ukraine”, Agencia de Noticias de Rusia TASS, 23 de septiembre 2021.
- [12] Redacción, “China supera a Japón como el mayor importador de GNL del mundo”, GNL Global, 5 de octubre 2021.
- [13] Hassan Balfakeih, “Monthly Oil Market Report September 2021”, OPEP, 13 de septiembre 2021.
- [14] 19th OPEC and non-OPEC Ministerial Meeting concludes, OPEP, 18 de julio 2021.
- [15] STATISTICS”, Ministerio de Energía de la Federación Rusa, primero de septiembre 2021.
- [16] “Short-Term Energy Ooutlook Data Browser”, Administración de Información Energética de EE.UU. (EIA), 08 de septiembre 2021.
- [17] “Weekly Supply Estimates”, Administración de Información Energética de EE.UU. (EIA), 30 de septiembre 2021.
- [18] “North America Rig Count”, Baker Hughes, 08 de octubre 2021.
- [19] Resolución 2231 (2015), Consejo de Seguridad de la ONU, 20 julio 2015.
- [20] Redacción, “Las conversaciones de Viena se reanudarán en las próximas semanas”, Agencia de Noticias de Irán IRNA, 21 de septiembre 2021.
- [21] “Declaraciones del presidente Biden ante la 76 ª sesión de la Asamblea General de la ONU”, Departamento de Estado EEUU, 21 de septiembre 2021.
- [22] Equipo de Prensa, “Gantz says Israel could accept new Iran nuclear deal”, The Times of Israel, 15 de septiembre 2021.
- [23] Equipo de Prensa, “Noruega avanza hacia un gobierno de izquierda sin alterar su política petrolera”, EFE, 15 de septiembre 2021.
- [24] “Plataforma Continental Presentación de Noruega sobre zonas del Océano Ártico, el Mar de Barents y el Mar de Noruega”, ONU, 2006.
- [25] David Niquel, “Norway Election 2021: What to Expect from the Likely New Government”, Life in Norway, 22 de septiembre 2021.
- [26] Jam Olsen, “Norway’s center-left heads to victory in general elections”, AP News, 13 de septiembre 2021.
- [27] David Shepardson, “UPDATE 1-U.S. road travel rose 11.5% in July as motorists near pre-pandemic driving”, Reuters, 23 de septiembre 2021.
- [28] Nota de Prensa, “Energy production in August of 2021”, Oficina Nacional de Estadísticas de China, 16 de septiembre 2021.
- [29] Weekly Stocks, Administración de Información Energética de EE.UU. (EIA), 6 de octubre 2021.
- [30] Mariana Párraga, “Diluent shortage curbs Venezuela’s September oil exports, data shows”, Reuters, 04 de octubre 2021.
- [31] Redacción, “Detenidos 7 trabajadores del Complejo Refinador Paraguaná acusados de terrorismo”, Banca y Negocios, 26 de septiembre 2021.
- [32] Declaración, “STATEMENT BY HEADS OF GOVERNMENT OF THE CARIBBEAN COMMUNITY ON THE IMPACT OF THE VENEZUELAN POLITICAL PARTIES AGREEMENT ON GUYANA”, CARICOM, 14 de septiembre 2021.
- [33] “América Latina y el Caribe: proyecciones de crecimiento, 2021-2022”, CEPAL, agosto 2021.


